Hopp til innhold
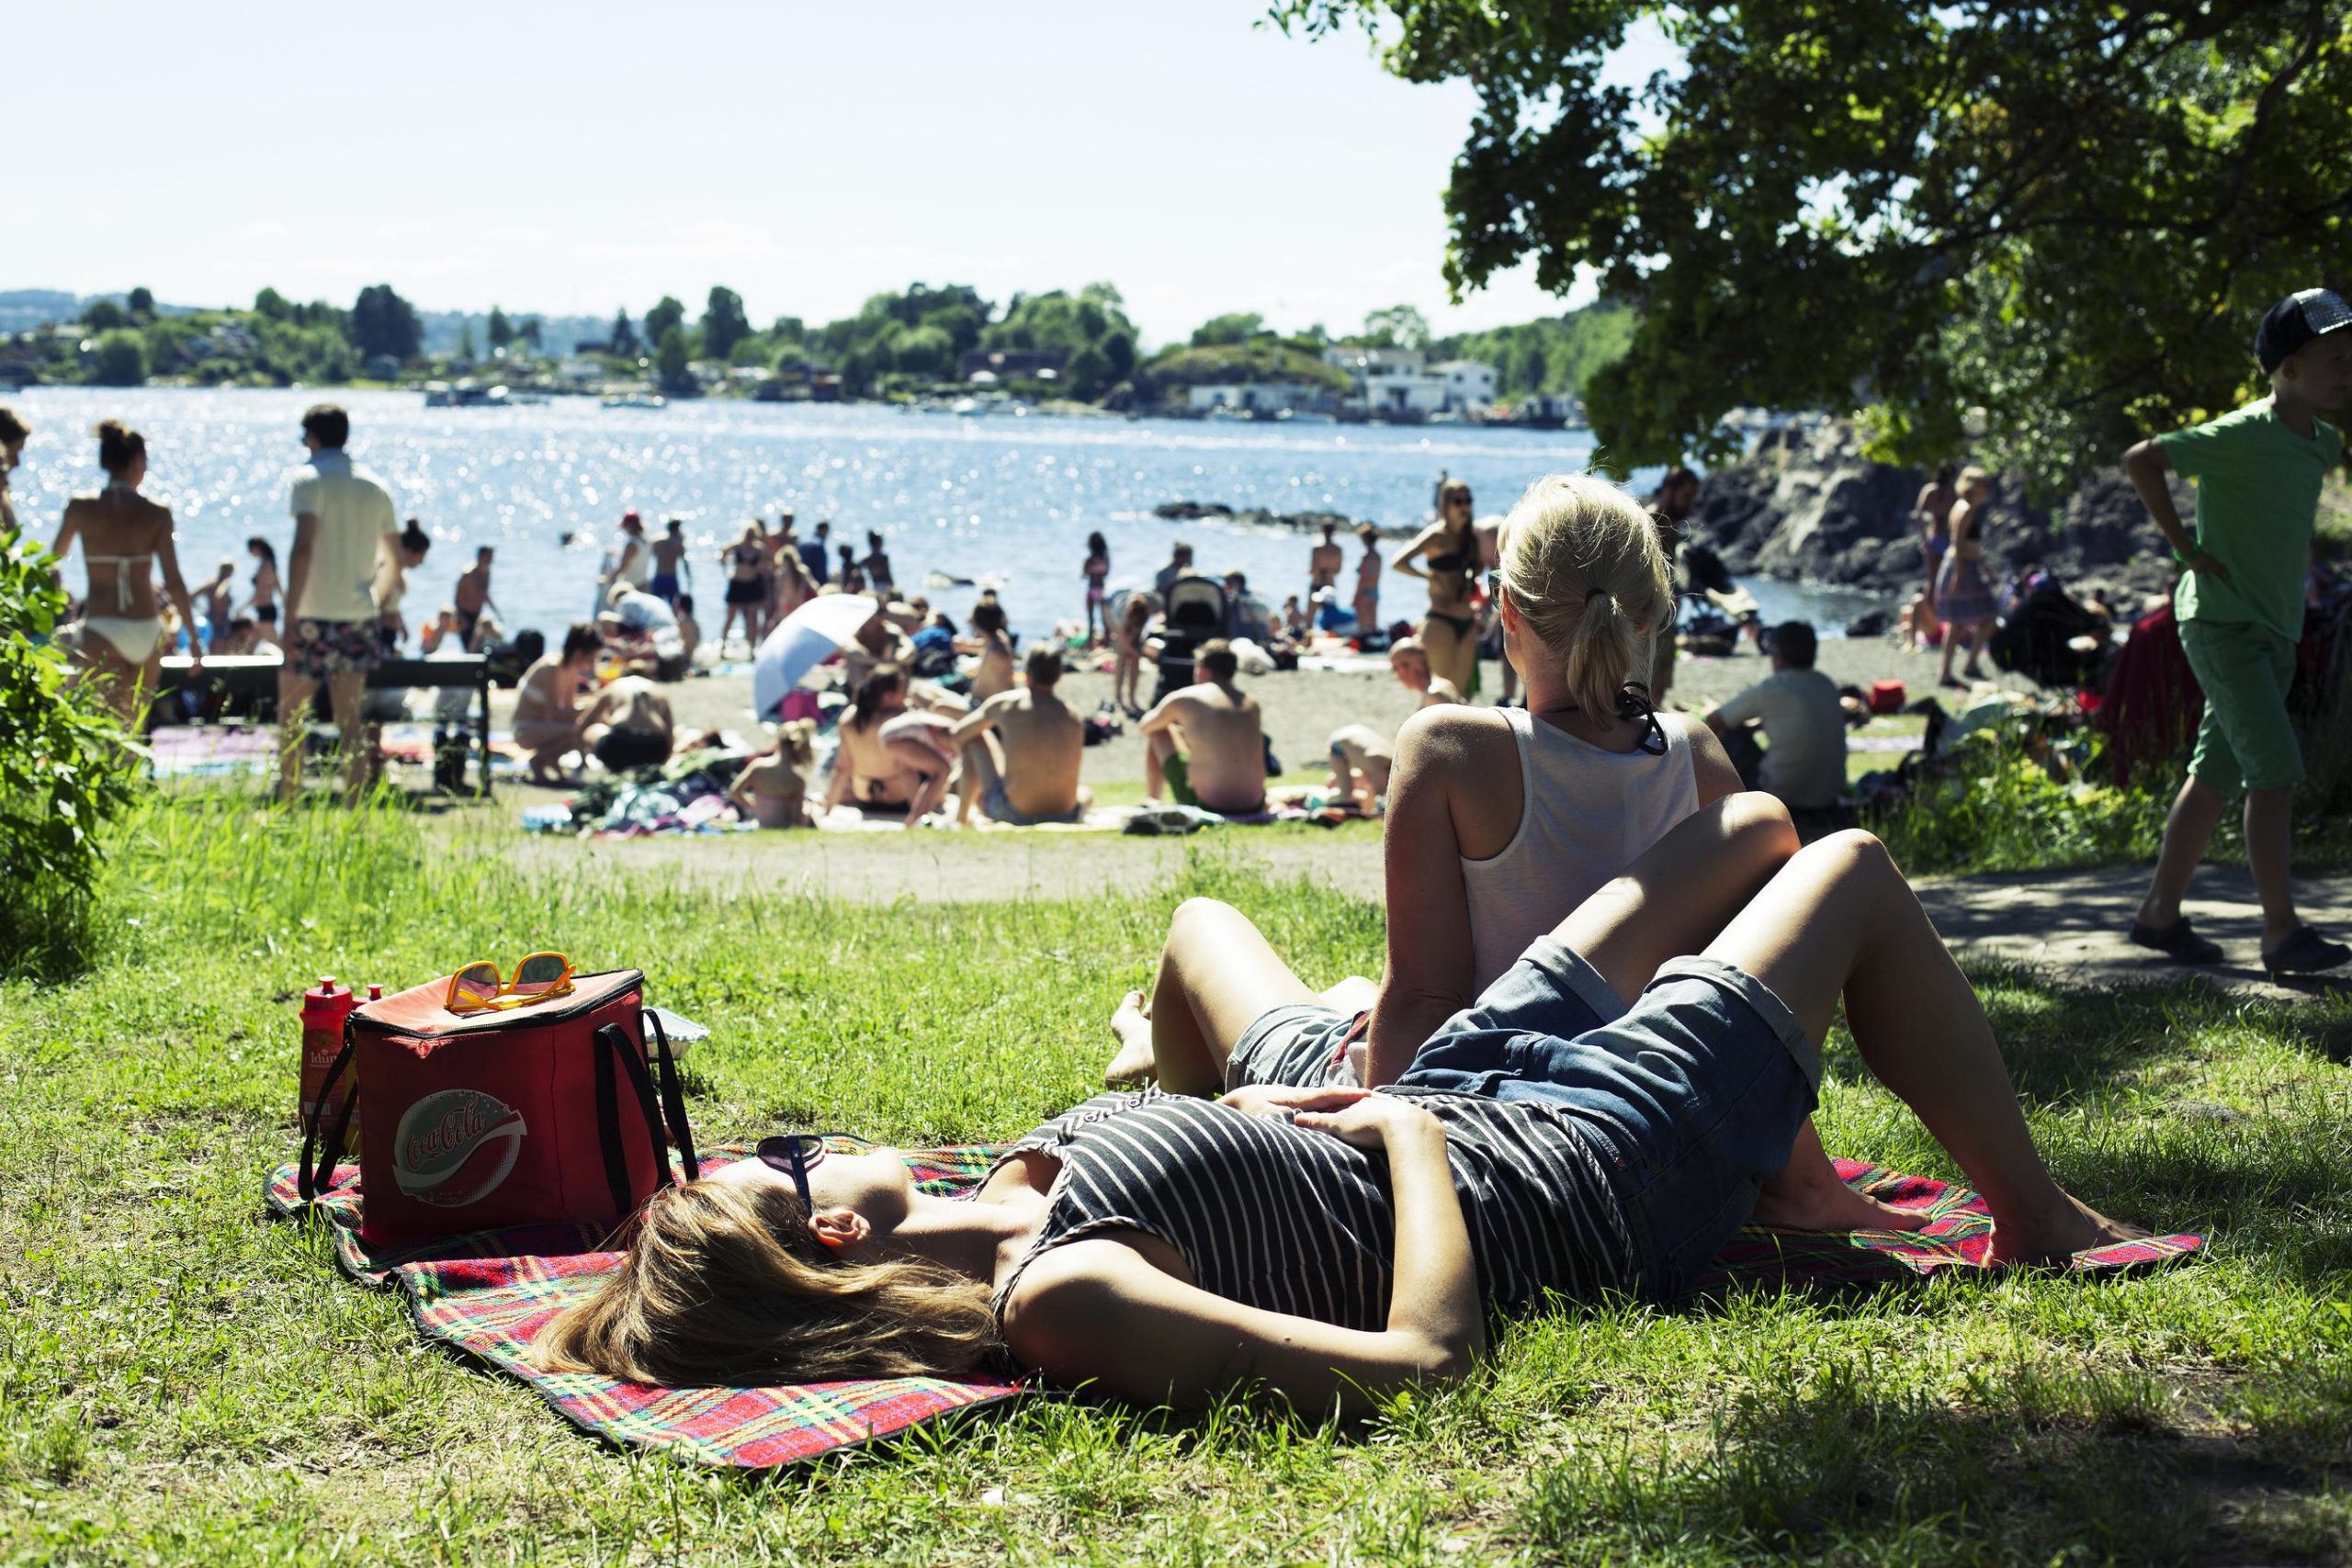
Two women sunbathe on the grass and look out over a crowded beach on a summer day.

Photo: Ruter As / Charlotte Sverdrup

Reducing our climate and environmental footprint

The climate crisis is the greatest sustainability challenge of our time. In addition to reducing society's emissions by ensuring that as many people as possible travel by public transport, Ruter works systematically to reduce its own emissions – both locally and in our value chain elsewhere in the world.

Why is the topic significant?

Ruter manages an extensive mobility service in the Oslo region and is responsible for reducing the negative impact this activity has on the climate and environment to a minimum.

GRI indicators

305-1: Direct greenhouse gas emissions (scope 1)
305-2: Energy – indirect greenhouse gas emissions (scope 2)
305-3: Other indirect greenhouse gas emissions (scope 3)
305-4: Emission intensity

Emission-free public transport by 2028

Ruter's most important contribution to reducing the environmental and climate impact of passenger traffic is to offer an attractive alternative to private cars. A well-developed and well-functioning public transport system is crucial for this positive trend to continue.

In addition to making the best possible offer to get more people to travel publicly, Ruter is also working to reduce emissions from our services. Ruter's goal is to operate emission-free before 2028, which will mean a significant reduction in both greenhouse gas emissions, local emissions and noise, to the benefit of both passengers and the general population.

Using contracts

The transition to emission-free operation at Ruter takes place as old transport contracts expire and are replaced with new ones, in tenders where environmental and climate considerations are either set as minimum requirements or awarded as extra points in allotment criteria. The operators compete on price, but equally important is that the tender competitions revolve around delivering bids that are attractive to customers and good for the environment.

On 27 June 2022, Ruter signed two new contracts with Unibus and Nobina for bus transport in eastern Oslo, which commence on 10 December 2023. As of that date, all Oslo contracts have been renewed, which means during 2023 virtually all buses on fixed routes in Oslo will be electric.

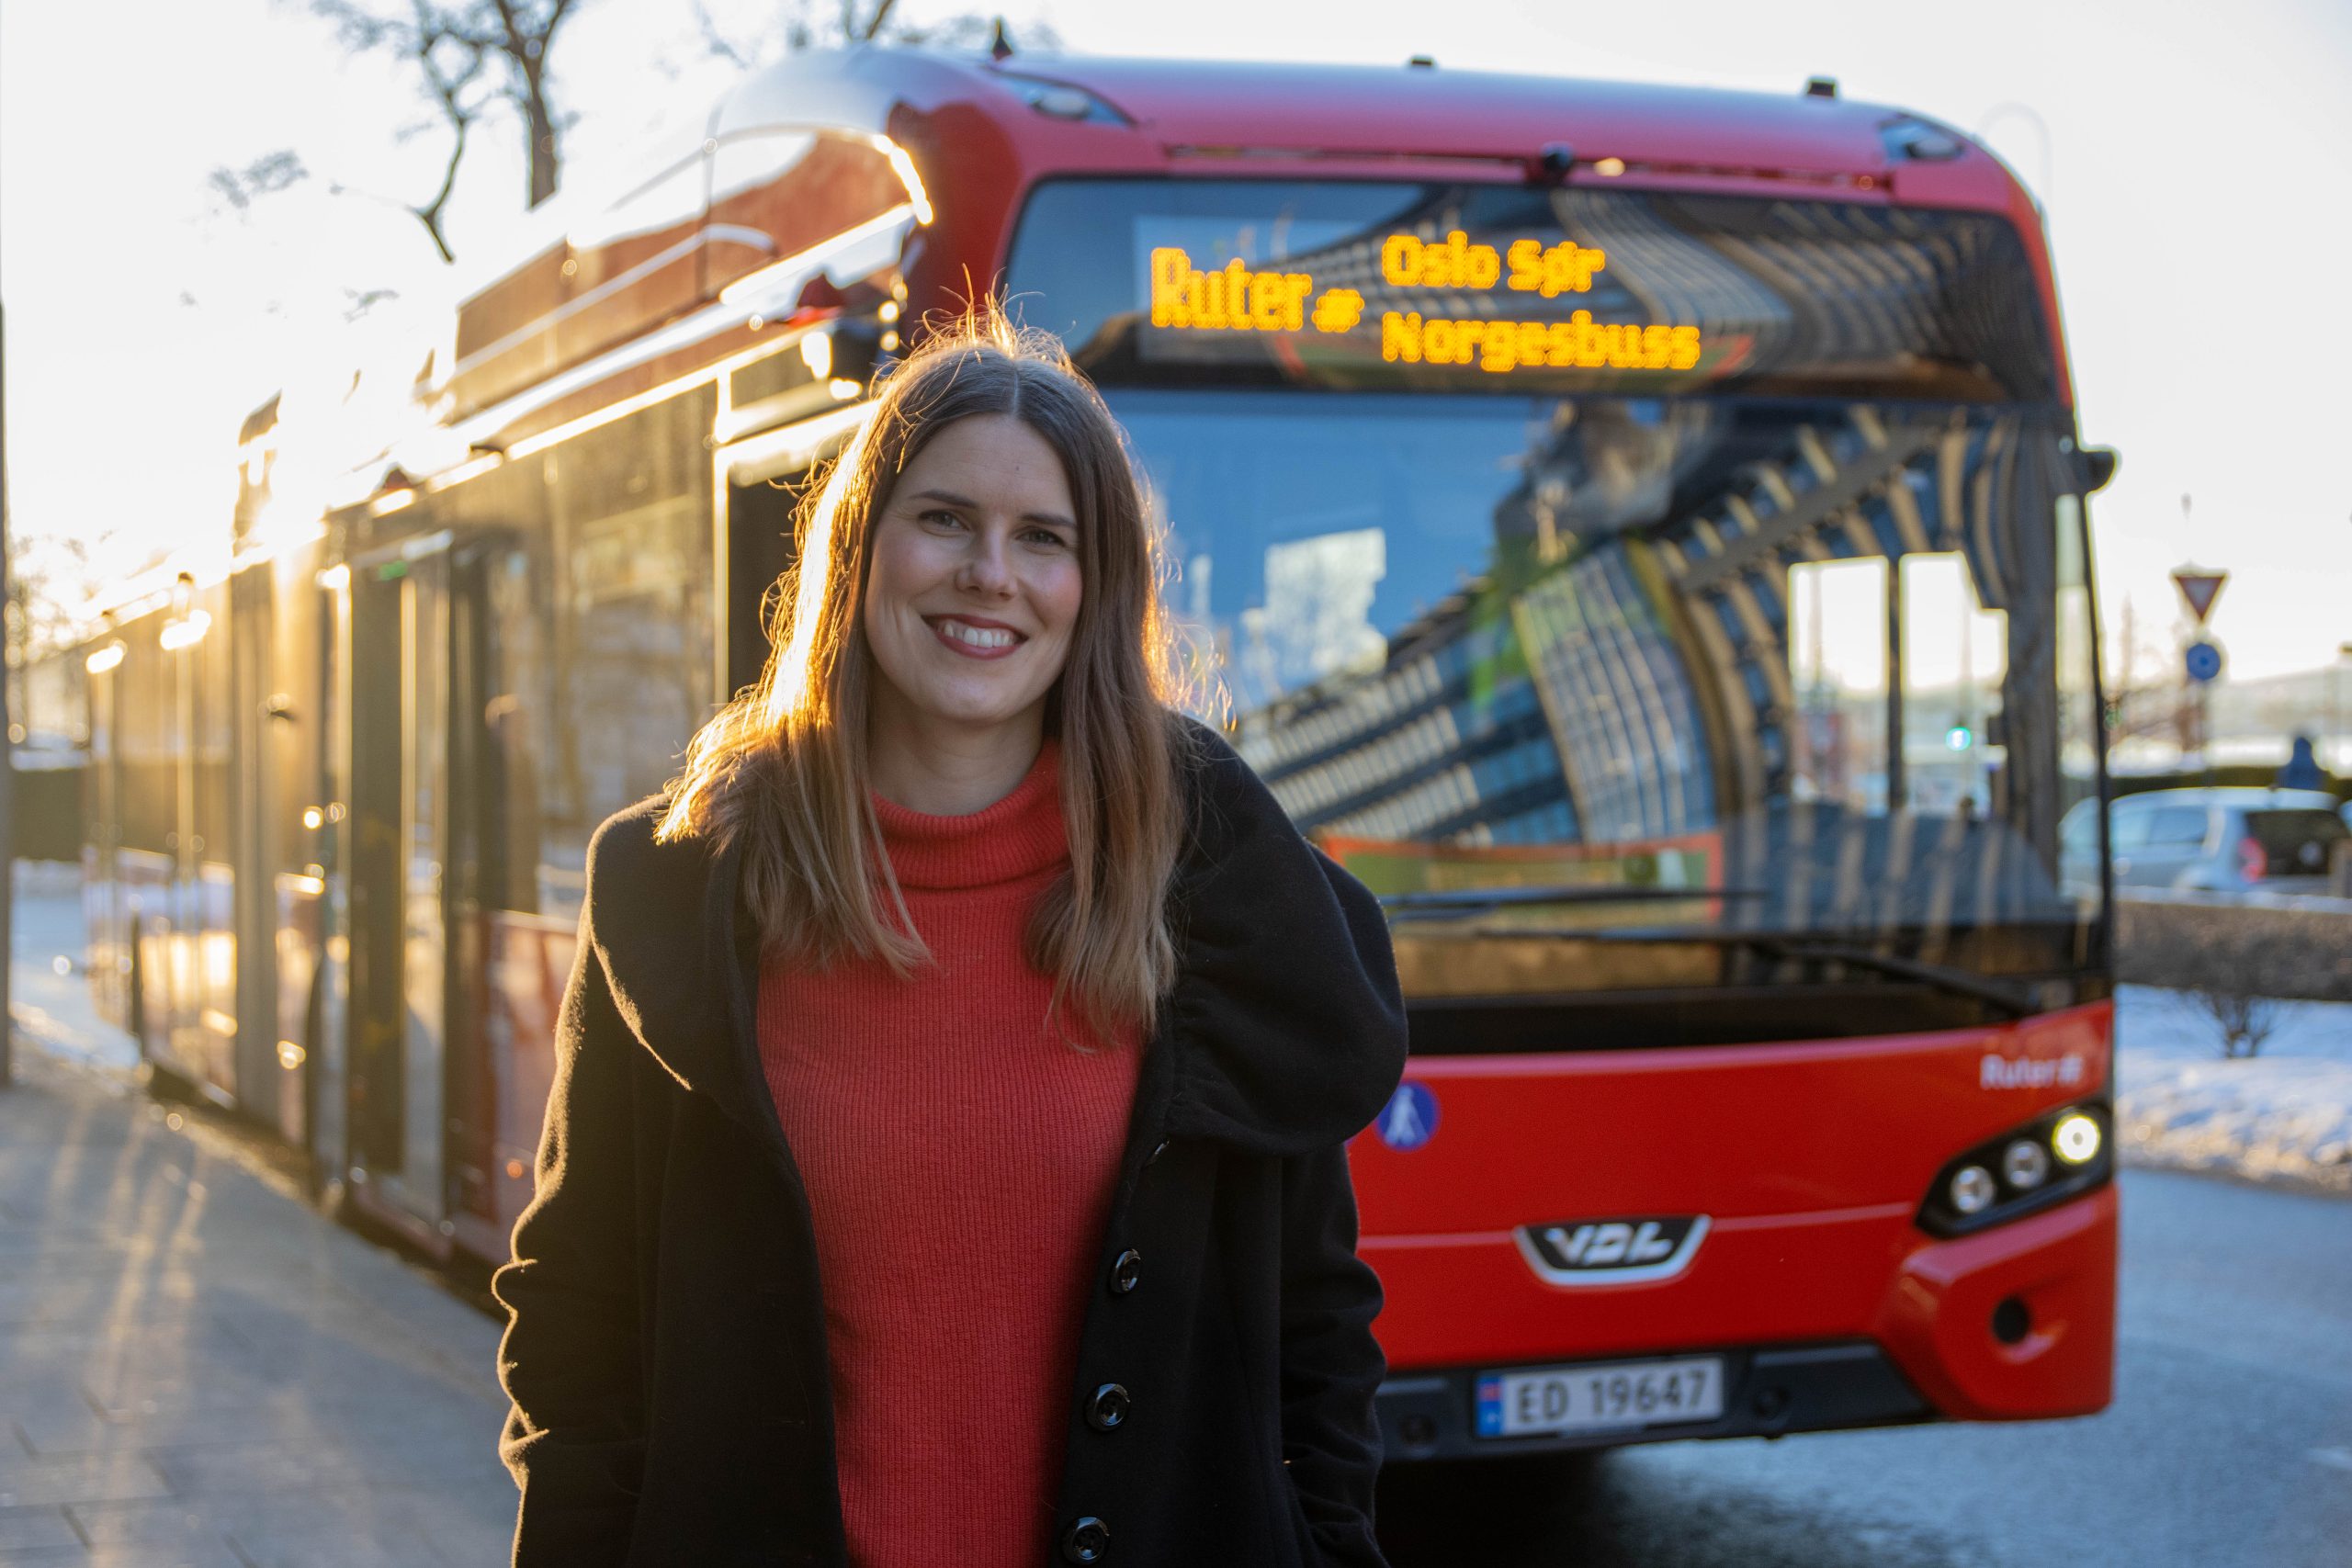
«The new electric buses in Oslo East mean cleaner air in these areas, less noise, more comfort and reduced greenhouse gas emissions»
Sirin Stav in front of an electric Ruter city bus.

Photo: Ruter As / Henrik Morsund Steinshamn

The island boats have finally arrived

The first boat arrived in December 2021, and during 2022 all the five new electric island boats were put into service – although somewhat delayed due to the coronavirus pandemic.

The new boats are larger and can accommodate far more passengers than the old ones. Unfortunately, the start-up phase was demanding, with many departures being cancelled.
The problems were due to both crew and materiel.

All the boats were delayed from the shipyard in Turkey, which affected the crew situation. There are strict and mandatory training and competence requirements associated with the new electric boats, and it takes time to train new crew.

Once the delivery was delayed, training was also delayed. These teething problems meant that much of the traffic was carried out with one of the old boats. These teething problems were over by December 2022, and boat operations began progressing according to plan.

Express boats will be emission-free

MS Baronen and MS Baronessen, which currently run a regular route in the Oslo Fjord, will be converted to zero-emission boats by installing a solution for battery swapping in the vessels. This contract was signed in 2022, and the boats will be in service by the summer of 2024.

The boats will be converted to zero-emission boats at the Brødrene Aa Shipyard in Hyen and be ready for commissioning in the summer of 2024.

«This is an important step in making public transport on the fjord emission-free. It is also an innovation project in which we will be the first to find such a solution»
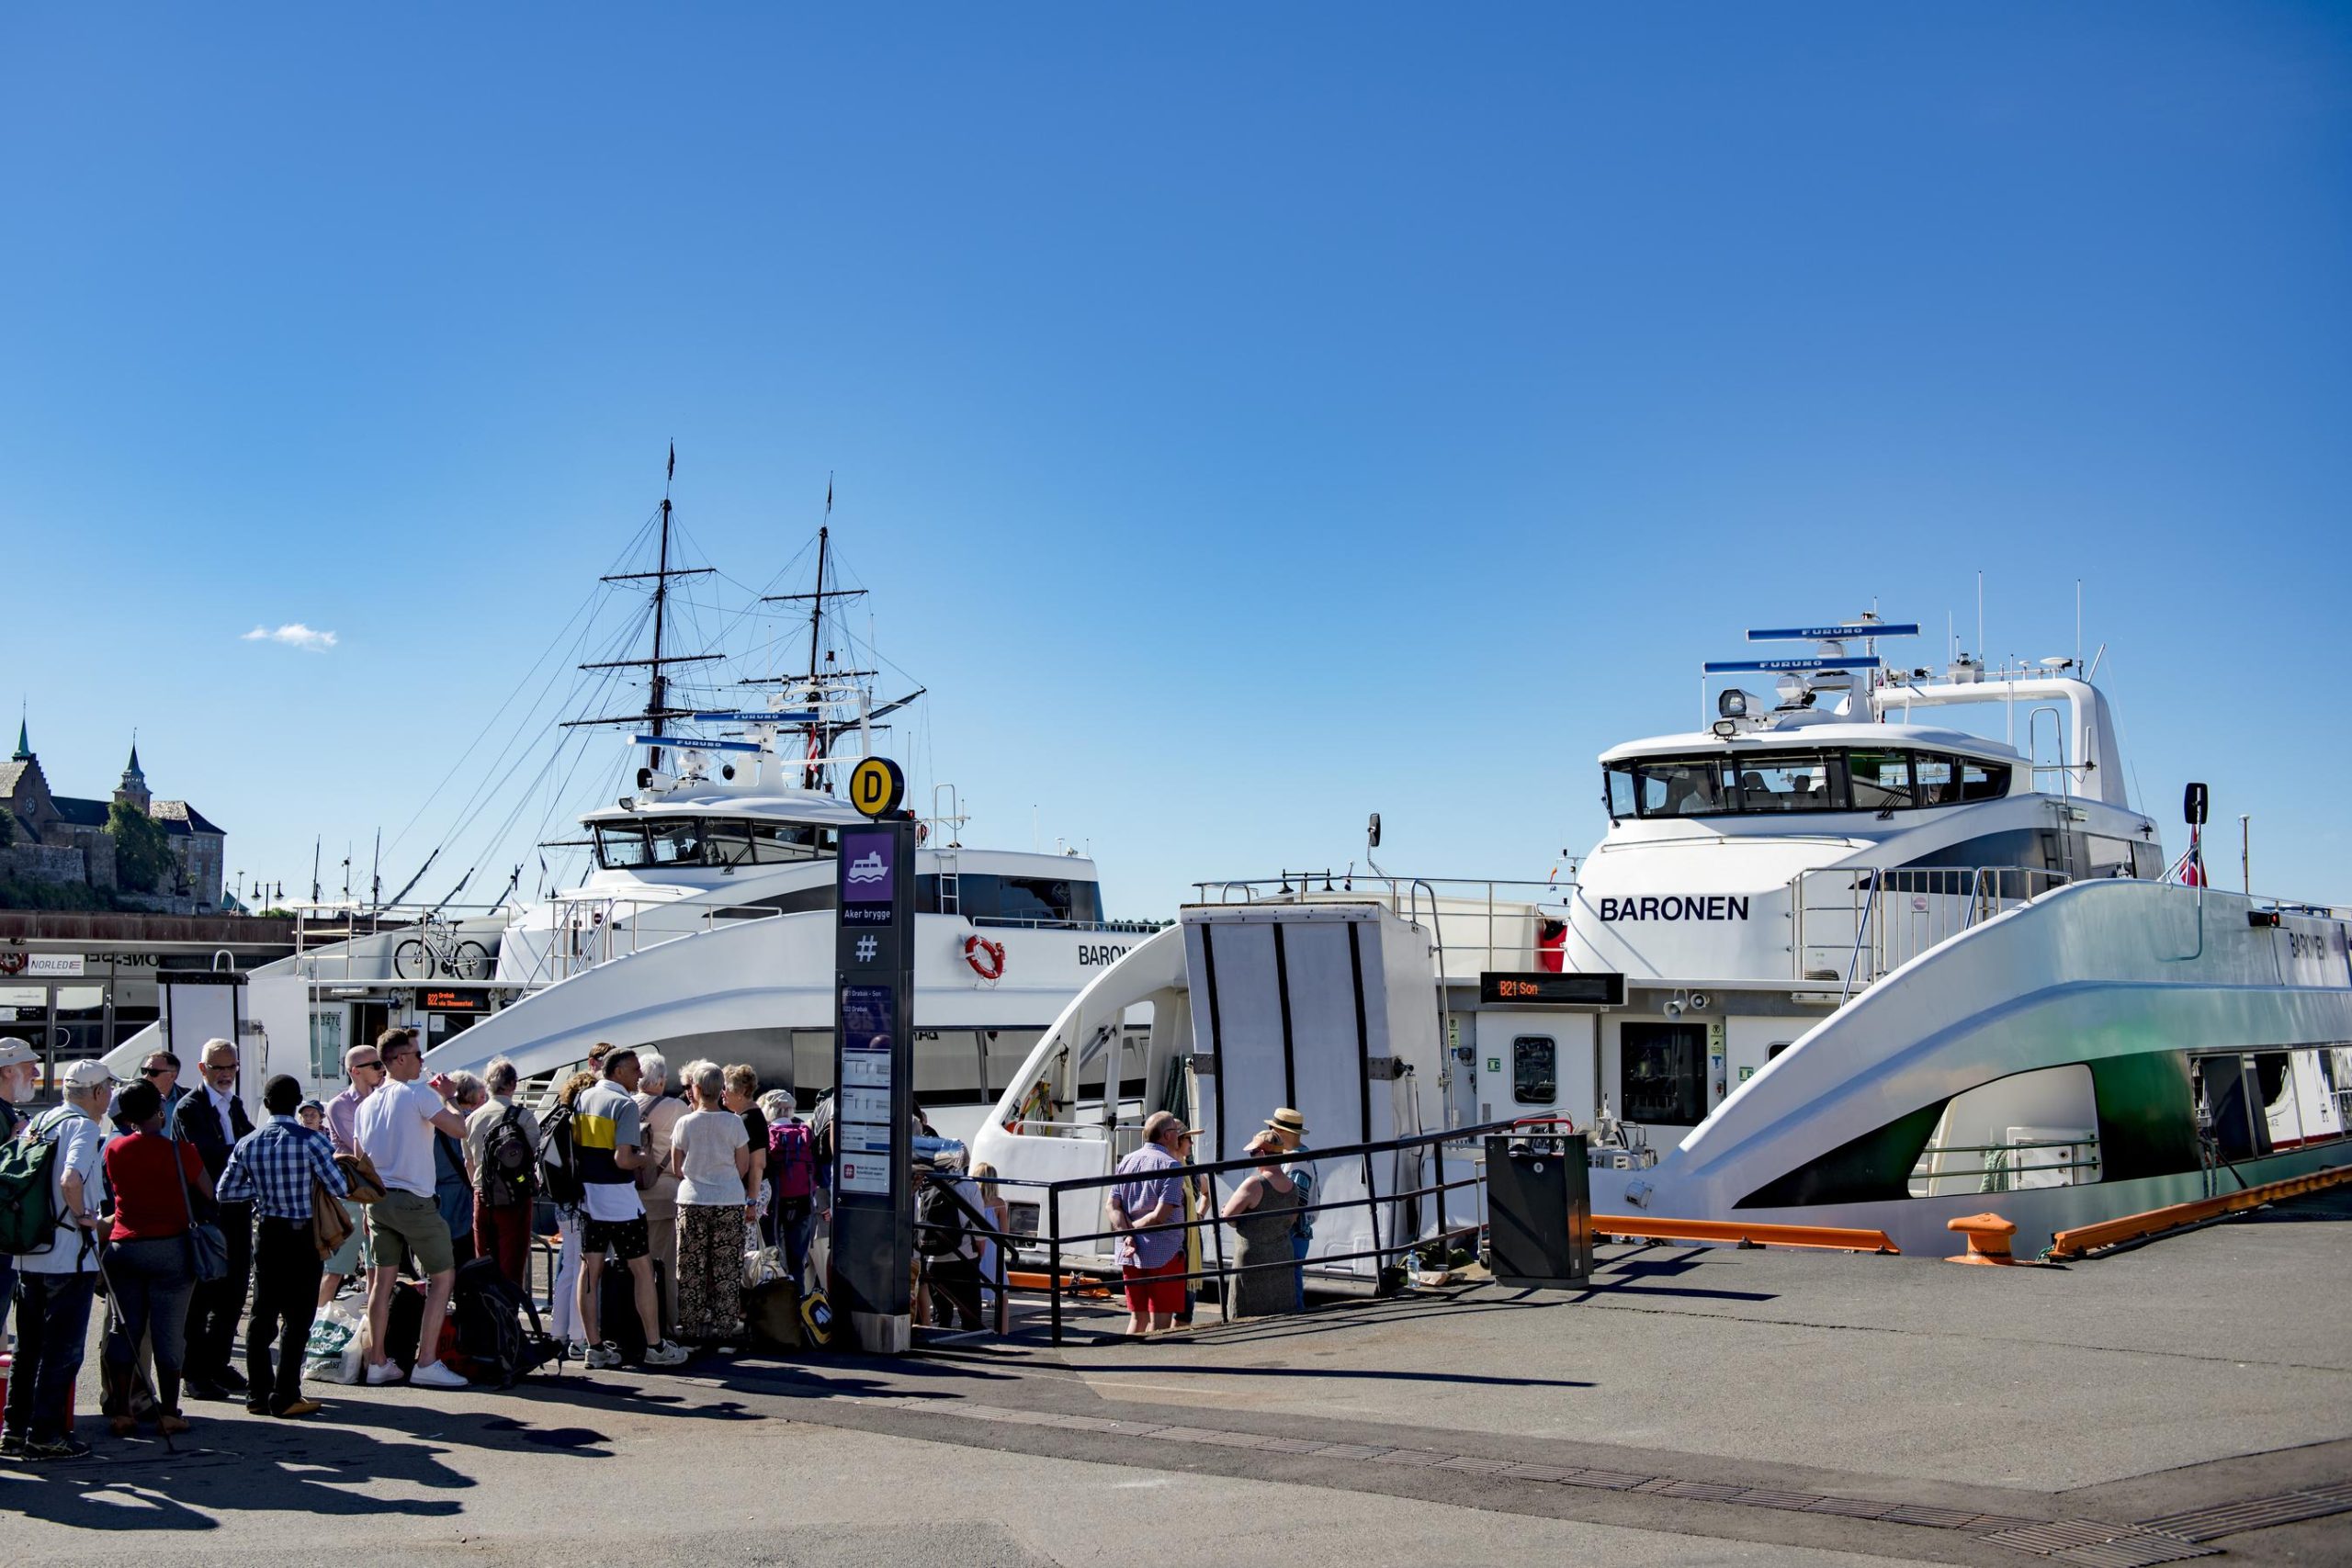
People queue to board a Ruter island ferry on a summer day.

Photo: Ruter As / Redink, Fartein Rudjord

Biogas in new bus contracts

Ruter defines emission-free operation as an offer carried out with vehicles or vessels where there are neither greenhouse gas emissions, NOx, nor particles from the vehicle’s engine. Emission-free public transport not only means lower greenhouse gas emissions, but also less noise and cleaner air.

For the new contracts in Oslo which start in 2022 and 2023, emission-free operation was a minimum requirement, and biogas was not permitted. Biogas is a valuable resource, but since biogas is used in combustion engines that make noise and emit NOx and particles, Ruter does not consider biogas to be emission-free.

Viken County Council decided in 2021 that biogas should be prioritised as a fuel together with electricity and hydrogen, and that what is chosen must be assessed specifically in each case based on climate and environmental benefits, local conditions and regional development needs.

Viken’s decision challenges Ruter’s goal of emission-free public transport. Ruter will work on the procurement of bus services in Follo throughout 2023. For these procurements, biogas will be permitted, and the fuel matrix for the Norwegian Government Agency for Financial Management, which recommends prioritising zero-emission technology and biogas in public procurements where transport is included, will be used as a basis for evaluating the tenders. Viken’s decision corresponds to the Storting decision to remove the state barriers to increased production and use of biogas.

The road to emission-free public transport

Scandinavia's first electric tram enters service in Oslo.
The first metro was put into service on the Lambertseter Line. Trams and metros are fully electric and are currently powered by GoO-certified electricity.
In August, ten electric minibuses will be put into operation in Romerike.
In November, six electric buses will enter service in Oslo as part of a two-year pilot project.
70 electric buses entered service in the spring of 2019, on 13 lines in Oslo. The buses were phased in via variation orders on existing contracts.
39 electric buses will start running in Lørenskog and Lillestrøm, in connection with the start of new bus contracts in Romerike on 30 June.
The three Nesodd ferries will be converted to electric operation and put into service.
18 electric buses will begin running in Asker and 23 in Vestre Aker during the summer, in connection with new bus contracts.
109 electric buses will begin operating in Oslo South as of January, in connection with the commencement of a new contract. They make up 96 percent of all buses. The five buses that run on Ulvøya are not electric, due to weight restrictions on the Ulvøy bridge.
Five electric island boats have been put into operation by Ruter in the inner Oslo Fjord.
Minibus and passenger car services in Follo, starting on 1 August, include 93 electric minibuses and passenger cars.
In April, 183 electric buses will be phased in in connection with the start of new contracts in the inner city.
137 electric buses will begin operations in connection with the start-up of new contracts in eastern Oslo in December.

By the end of 2023, virtually all public transport in Oslo will be emission-free*

By the end of 2028, all public transport throughout Ruter’s areas will be emission-free

* The fact that we do not reach 100% emission-free operation is due to circumstances beyond Ruter’s control. Two bridges currently make it impossible to operate electric buses on Line 42 (the clearance height on Lysaker bridge is too low for today’s electric buses) and Line 85 (Ulvøya bridge must be reinforced or rebuilt).

Ruter's greenhouse gas emissions

This chapter shows and explains the greenhouse gas emissions coming from Ruter's operations. In the first part (Ruter's greenhouse gas emissions from operations), we have highlighted the local emissions that occur in our area as a result of driving and sailing Ruter's vehicles and vessels. Under the heading Ruter's Climate Accounts, you will find an overview of the total emissions, which includes emissions related to the production of materials, operational emissions, energy consumption and business travel.

Ruter's greenhouse gas emissions from operations

With our new climate accounting setup, which is more in line with the GHG Protocol than previous reports, direct emissions from driving and sailing are not as clearly visible. We know that this is something many are interested in, and therefore have a separate graph and table for direct emissions from driving and sailing below. Note that the same emissions are included in the complete emission account under Ruter’s Climate Accounts.

Direct emissions from operations include exhaust emissions from Ruter’s buses and boats that burn fossil diesel. Ruter has set an ambition of emission-free operation throughout our area by 2028. We are well on our way to achieving this goal, and by 2023 we will almost reach the finish line in Oslo. Operational emissions have decreased every year from 2018 to 2021, in line with the phasing-in of electric vehicles and the use of bio-diesel and biogas. For 2022, however, operational emissions have risen significantly in Viken. This is due to Ruter’s phasing out of biodiesel.

Phasing out biodiesel

Due to increased taxes and changes in biofuel sales requirements, Ruter decided towards the end of 2021 to revert to the use of fossil diesel for large parts of our offer. Changes in the road use tax and the biodiesel sales requirement would have resulted in considerable additional costs and thus major cuts in route services. The Municipality of Oslo chose to finance the continued use of biodiesel in its area, until the bus service in Oslo becomes fully electric in 2023.

In any case, the design of the sales requirement means that the climate effect from a societal perspective is zero if Ruter had continued with biofuels. The sales requirement requires companies selling fuel to have 17% of their total sales in biofuel. This means that if Ruter had maintained our use of biodiesel, the consequence would have been reduced blending for other customers, and thus no emission reduction.

Emissions and consumption from operation

Below is an overview of the direct greenhouse gas emissions, as well as the electricity consumption, from the operation of Ruter’s services. These emissions are also included in the complete climate accounts below.

Note that we are now, retroactively, separating biogenic emissions from consumption of ordinary diesel according to average blending.

The entire Ruter area

Direct emissions in tonnes of CO2 from the entire Ruter area

Oslo

Direct emissions in tonnes of CO2e Oslo

Viken

Direct emissions in tonnes of CO2e Viken

Direct emissions in tons of CO2e(TtW)201720182019202020212022
Total44 42953 03141 91026 19919 60554 549
Oslo15 71120 52116 69914 70612 3949 144
Viken28 71832 50925 21211 4937 21045 405
Bus35 44645 55634 86721 76516 26751 444
Oslo15 71120 52116 69914 70612 3119 144
Viken19 73525 03418 1697 0593 95642 301
Boat 8 9837 4757 0434 4343 3383 105
Oslo0000830
Viken8 9837 4757 0434 4343 2553 105
Total biogenic36 23143 37651 04357 35667 94926 128
Oslo14 74518 44120 21118 97621 43817 963
Viken21 48524 93630 83238 38046 5118 165
Electricity consumption in mWh201720182019202020212022
Total121 328126 065127 874141 622154 513171 651
Oslo121 328126 065126 277131 046143 200159 972
Viken001 59710 57611 31311 679
Bus003 3949 93712 46920 880
Oslo001 7974 8466 56415 143
Viken001 5975 0915 9055 737
Boat0005 4855 4086 788
Oslo000001 357
Viken0005 4855 4085 431
Tram20 14022 42324 31922 80021 78835 487
Oslo20 14022 42324 31922 80021 78835 487
Viken
Metro101 188103 642100 161103 400114 848107 398
Oslo101 188103 642100 161103 400114 848107 398
Viken
Special transport1 098
Oslo587
Viken511

Emission intensity (305-4)

Below is the emission intensity calculated for the various modes of operation based on direct emissions from operations and the number of passenger-kilometers (pkm).

Emission intensity (kg fossil CO2e / passenger-kilometer)1 201720182019202020212022
Total20,0200,0230,0180,0200,0140,038
Oslo0,0120,0150,0120,0210,0160,009
Viken20,0340,0370,0270,0190,0110,103
Bus0,0270,0330,0240,0260,0180,068
Oslo0,0330,0400,0300,0570,0470,027
Viken20,0240,0290,0200,0120,0060,100
Boat0,3920,3030,2740,2840,2210,147
Oslo0,0000,0000,0000,0000,0440,000
Viken0,4450,3560,3080,3140,2470,167
Tram0,0010,0020,0020,0040,0040,004
Oslo0,0010,0020,0020,0040,0040,004
Viken
Metro0,0020,0020,0020,0020,0030,002
Oslo0,0020,0020,0020,0020,0030,002
Viken

1The calculations of emission intensity include only direct emissions from fossil fuels for buses and boats, and emissions from traction current according to the location-based method for trams and metros.

2 Changed method for calculating passenger-kilometers for regional buses from 2022. The figures are therefore not comparable with previous years.

Ruter's Climate Accounts

Ruter expands its emission reporting

As of 2022, we are expanding our climate accounts to include emissions from the production of new materiel, i.e. new buses, trams, boats and other vehicles. We are also establishing a clearer classification between direct emissions (scope 1), indirect emissions resulting from energy use (scope 2) and other indirect greenhouse gas emissions (scope 3). We now also include additional greenhouse gases beyond CO2 (converted to CO2e). These changes have been made to ensure that reporting complies with the guidelines for the Greenhouse Gas Protocol (GHG Protocol).

We report our emissions according to the GHG Protocol’s approach to operational control. As a management company, all significant activities are carried out by our operators. As operators have a significant influence on how they want to provide their services, we do not have full operational control over this activity. Emissions from operator activities are therefore defined as our Indirect Emissions (scope 3).

This means that Ruter in practice has no direct emissions (scope 1), and that scope 2 only includes the management company’s consumption of electricity and district heating for our office premises. It is important to point out that this is purely a technical accounting consequence, and that we naturally take responsibility for the overall emission inventory, including scope 3.

Under scope 3 we find the largest emissions for which Ruter is responsible. Given our organizational structure, these emissions are mainly in Category 1 of the GHG Protocol: «Purchase of goods and services». Of the other 14 categories, only business travel and employee commuting are relevant, as everything else falls under category 1. However, employee commuting is considered insignificant, as a combination of Ruter’s central location near the central train station in Oslo, as well as free tickets for employees, probably results in a very high proportion of public transport, cycling and walking. In the link below, you can download detailed information about greenhouse gas emissions, NOx emissions, energy consumption, fuel consumption and mileage for buses, boats, trams and metros in Oslo and Viken/Akershus.
Emissions from the value chain

In 2022, we have worked to calculate emissions from the production of new vehicles and vessels; i.e. trams, metro cars, buses and boats. This is complex work where unfortunately there is a lack of standards and good emission factors. The consequence of this immaturity is that there will be considerable uncertainty associated with the precision of the reported figures. Although the estimates are uncertain, we nevertheless believe it is appropriate to include these figures in our emission accounts: it shows that we have significant emissions associated with the production of the operating equipment and provides a good starting point for understanding the totality of our indirect emissions.

In the years ahead, we will work with the supply chain to improve data to reduce uncertainty.

One consequence of the fact that we now include emissions from the production of vehicles and vessels in our climate accounts is that there may be large variations in Ruter’s total emissions from year to year, depending on how many new vehicles are put into operation each year. For example, 2022 has been a year in which a lot of new materiel has been put into operation, while 2021 was a year in which relatively few vehicles entered traffic. In 2022, the following vehicles and vessels became operational: 96 new buses in the Oslo South area, four new island boats, 15 new trams and 162 new minibuses for special transport. In total, this gives 41 406 tons of CO2e in production emissions for 2022, while the corresponding figure for 2021 was 4412 tons CO2e.

Ruter's greenhouse gas accounting (305)1

All figures are in tons of CO2e

Scope 1 (305-1)201720182019202020212022
N/A000000
Total scope 1000000
 
Scope 2 (305-2)201720182019202020212022
Electricity in relation to office buildings
Location-based568
Market-based2250237269
District heating3555
Total scope 2 (location-based)101113
Total scope 2 (market-based)255242274
 
Scope 3 (305-3)201720182019202020212022
Category 1: Purchase of goods and services
Bus services
Emissions from driving (TtW)35 44645 55634 86721 76516 26751 444
Emissions from fuel production (WtT)13 35715 57315 33413 6065 58116 359
Emissions from driving electricity (Norwegian mix)5005879137251
Bus production419 0522 07084 45942 8612 39520 391
Boat services
Emissions from sailing (TtW)8 9837 4757 0434 4343 3383 105
Emissions from fuel production (WtT)9881 0381 2441 105810770
Emissions from sailing electricity (Norwegian mix)5000445981
Boat production4004042022 0178 068
Tram services
Emissions from driving (Norwegian mix)5,6242269413182240426
Tram production4000006 405
Metro services
Emissions from driving (Norwegian mix)5,61 2141 2441 7038271 2631 289
Metro train production4000000
Special transport
TT (adapted transport) and age-friendly - driving77
TT (adapted transport) and age-friendly – equipment8000001 715
On-demand transport Viken – driving71 382
On-demand transport Viken – equipment8001 440003 445
Category 6: Business trips
Air travel9119640
Travel by car10214422
Total scope 379 28473 345146 96985 10932 115115 180
 
201720182019202020212022
Total emissions (scope 1, 2 and 3) – location-based79 28473 345146 96985 11932 126115 193
Total emissions (scope 1, 2 and 3) – market-based77 82871 832144 79584 23130 658113 408
 
Outside of scope201720182019202020212022
Biogenic emissions (tons CO2e)36 23143 37651 04357 35667 94926 128

1 Methodological changes from previous years (all have been retroactive): (1) For fossil fuels with a biofuel blend, emissions from the latter are separated out as biogenic emissions. (2) Including several of our indirect emissions, also the production of fuel, new materiel (wheeled vehicles and seagoing vessels) and traction current.
DEFRA’s emission factors are used unless otherwise specified.
For cells that are empty, we lack data.

2 Ruter does not purchase a Guarantee of Origin (GoO) for electricity for office operations. NVE’s emission factor for residual mix used, of which the average for 2019 – 2021 is used for 2022.
3 Celsio’s EPD for district heating in Oslo (13g CO2e / kWh)
4 Roughly estimated based on weight and possibly battery capacity. Large emissions are related to the start-up of new contracts and associated new vehicles and vessels.
5 Norwegian electricity mix (location-based). NVE does not have emission factors for 2017, 2018 and 2022. Used average of 2019-2021 for these years. This electricity has a Guarantee of Origin and is emission-free according to market-based methods.
6 New method for distributing electricity consumption between tram and metro results in increased consumption for trams and reduced consumption for metro in 2022 compared to previous years.
7 Calculated based on planned execution.Calculated based on stated energy consumption of the vehicles.
8 Includes only new vehicles running only for Ruter. Vehicles from driving assignments are in use for age-friendly transport.
9 Based on journeys booked through Ruter’s travel agency. Data for 2019 and 2020 is missing.
10 Based on mileage allowance paid. DEFRA factors per km (however, this is probably too high given Norwegian electric vehicle ownership).

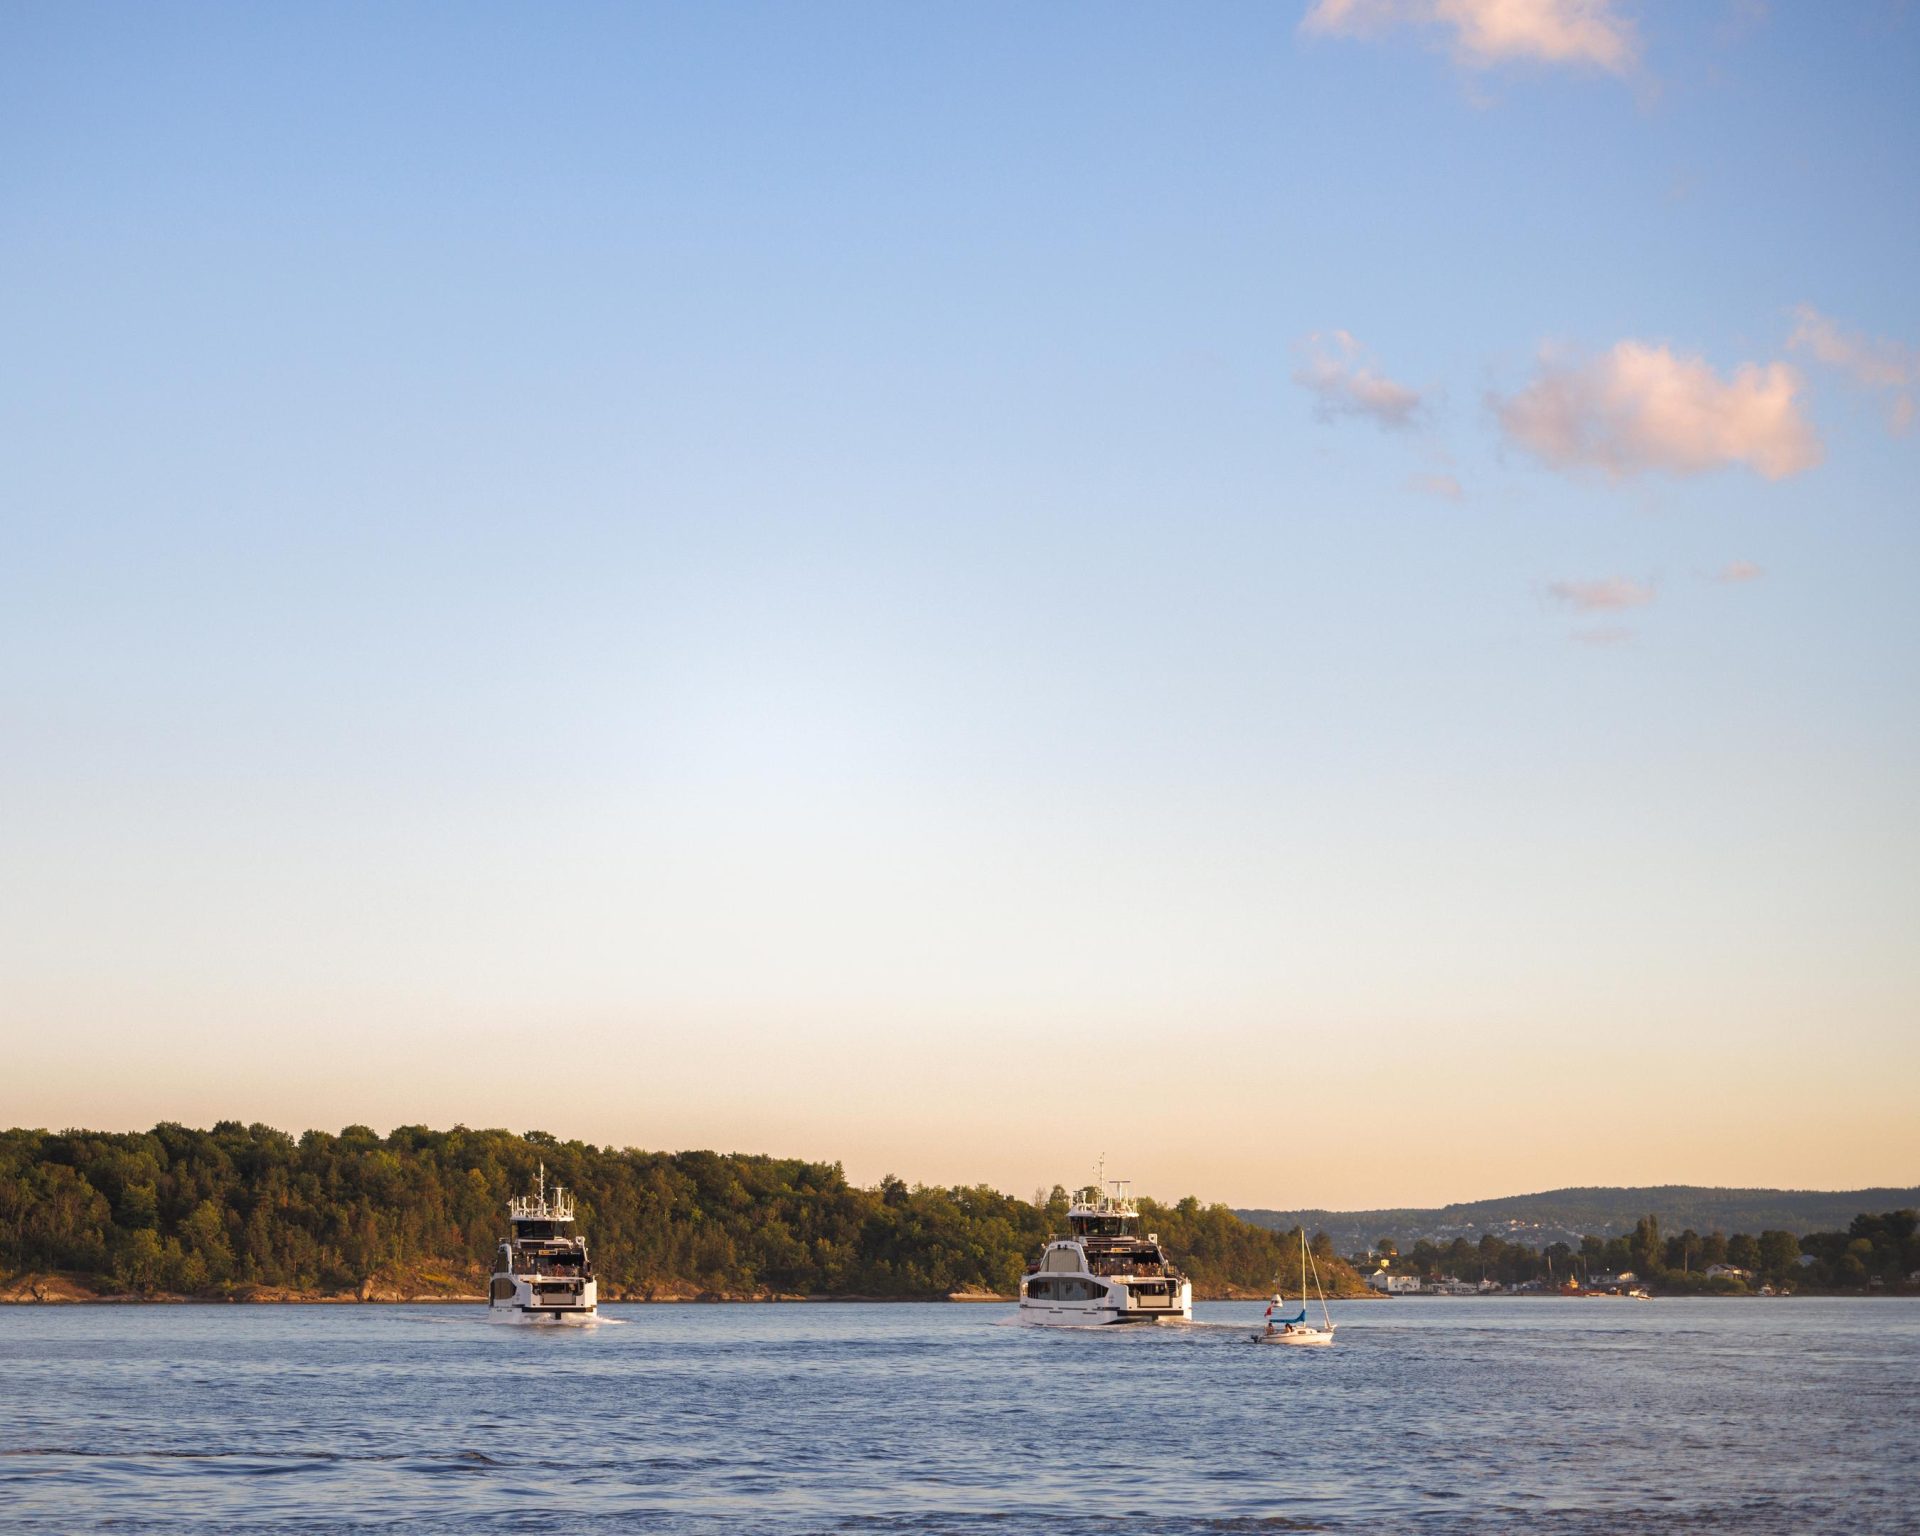
Two Ruter island ferries on the sea at sunset.

Photo: Ruter As / Nucleus AS, Øyvind Ganesh Eknes

Ambition for emission-free operation by:
2028
Mission achieved In Oslo:
2023